What Does Your Bike Actually Cost Per Kilometre?

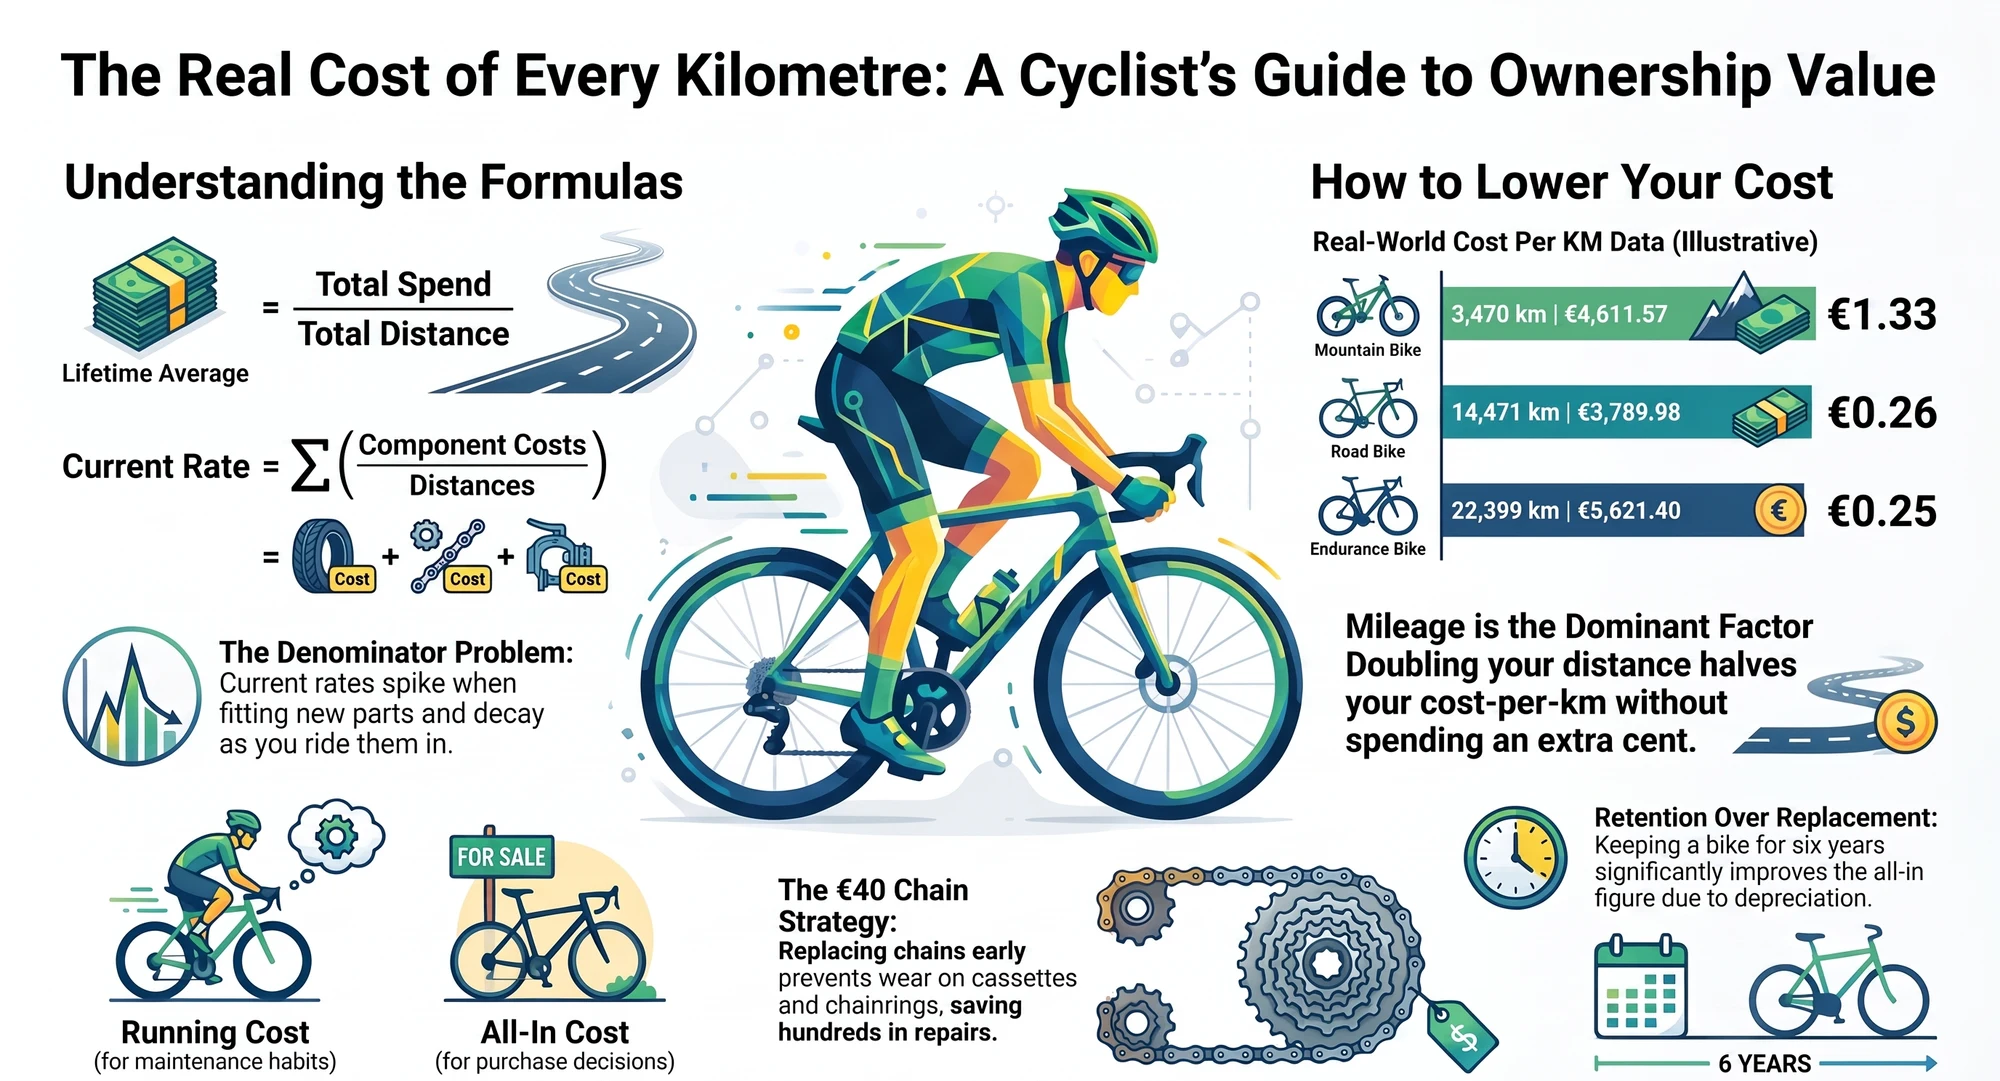
Quick answer: Cycling cost per kilometre is spend divided by distance, and the answer depends entirely on which denominator you use. My own mountain bike has a €4,611.57 build cost over 3,470 km, which is €1.33 per km as a lifetime average — but €2.27 per km when each component is divided by its own distance rather than the bike's. Both are correct and they answer different questions. The fastest way to lower either figure is not buying cheaper parts, it is riding more kilometres on the parts you already own.
Somebody at the café asks what the bike cost. You know that number. Then they ask whether it was worth it, and you have nothing — because "worth it" is a rate, not a price, and nobody tracks the rate.
Cars have solved this. Every fleet manager knows their cost per kilometre, and it is the number that decides whether a vehicle stays. Cycling has receipts scattered across two years of emails and a rough sense that the drivetrain was expensive that one time.
Key takeaways
- The denominator decides the answer. My own bike reads €1.33/km as a lifetime average and €2.27/km as the sum of each part divided by its own distance — a 70% spread on identical spending.
- Distance is the dominant term. Across the four bikes in my own garage the rate spans €0.14 to €1.33 per km — a 9.5x spread driven by mileage and upgrades, not by one bike being a worse buy.
- The chain is where the biggest saving sits, because replacing it on time protects the two expensive parts behind it.
- There is no published benchmark for personal cycling cost per km. The academic figures you will find measure something else entirely.
- Cost per km only becomes real when component distances are tracked per part, not per bike.
Table of Contents
- The formula, and why it is two formulas
- A worked example: my Scalpel
- The same question across a whole garage
- What counts as normal
- What actually moves the number
- How WatchMy.bike calculates it
- FAQ
The formula, and why it is two formulas
The arithmetic is trivial. Deciding what belongs on top is where every published figure quietly disagrees with every other one.
Running cost per km:
(consumables + service labour) ÷ kilometres ridden
Consumables are the things you knowingly replace: chains, cassettes, chainrings, brake pads, tyres, cables, bar tape, sealant, lubricant. Service labour is what you pay someone else, or nothing if you do it yourself.
All-in cost per km:
(consumables + service + depreciated purchase price) ÷ kilometres ridden
Depreciated purchase price is what the bike has lost in value so far, not what you paid. A €4,000 bike now worth €2,500 has cost you €1,500 in ownership, regardless of what the receipt said.
Run both. Running cost tells you whether your maintenance habits are expensive; all-in cost tells you whether the bike was a good decision. They answer different questions and they are usually an order of magnitude apart. Both depend on knowing distance per component rather than per bike, which is the mechanics covered in how to track bike maintenance.
Two decisions that change the answer
Do you count your own labour? If you fit your own chain, the running cost of that job is the price of the chain. A shop doing the same work might charge €15 to €25 on top. Neither is wrong — just be consistent, and know which convention your number uses before comparing it with anyone else's.
Do you count kit? Shoes, helmet, bibs, a computer. I would leave them out of the bike's cost per km. They are not consumed by kilometres in the same way and including them makes the figure incomparable between riders.
A worked example: my Scalpel
These are the real numbers from my own mountain bike, a 2021 Cannondale Scalpel Carbon 3 I bought second-hand via Buycycle from a seller in Denmark, then upgraded fairly heavily.
| Build cost (purchase + 29 tracked components) | €4,611.57 |
| Distance tracked since I bought it | 3,470 km |
| Cost per km, as my own app reports it | €2.27 |
Now do the division yourself: €4,611.57 ÷ 3,470 km is €1.33 per km, not €2.27. Both numbers are right, and the gap between them is the whole point of this post.
€1.33 is the lifetime average. Everything I have spent, spread across every kilometre I have ridden. It answers "what has this bike cost me per km so far".
€2.27 is the sum of each part's own rate. The app divides the bike's purchase price by the bike's distance, then adds each fitted component's price divided by that component's own distance — the kilometres the part itself has done, including any it did on a previous bike. A rear tyre fitted new 400 km ago is carrying its full price across 400 km, not across 3,470. It answers "what is this bike costing me per km at the moment", which is a current burn rate rather than a historical average.
That second figure has a characteristic worth knowing: it spikes when you fit something new and decays as you ride it in. A €90 cassette installed last weekend contributes an enormous per-km number for a fortnight. If you check your cost per km the day after a big service, it will look alarming and it will be wrong about your actual cost of ownership.
What the second-hand purchase does to the denominator
The Scalpel is a 2021 frame and I am its second owner. Those 3,470 km are my kilometres, not the bike's. It arrived from Denmark with an unknown amount of wear already on it, and no seller-supplied history to reconstruct — the exact problem the tracking guide says to solve by starting the clock at purchase instead of guessing backwards.
For cost per km that turns out to be the correct thing to do anyway. I did not pay for the previous owner's kilometres, so they do not belong in my denominator. My figure is honest about my own cost and says nothing about the frame's total life, which is fine, because I am the one paying.
It also means my number is high and falling. €2.27 per km on 3,470 km is what a heavily upgraded bike looks like early. Every ride lowers it, and nothing about that requires me to spend differently — which is the argument in the next section, on my own data.
The same question across a whole garage
One bike is a data point. Here are the four bikes in my garage that have costs recorded against them, worst rate first:
| Bike | Distance | Build cost | Cost per km |
|---|---|---|---|
| Scalpel (MTB, heavily upgraded) | 3,470 km | €4,611.57 | €1.33 |
| Trigger (MTB, 11 tracked parts) | 14,471 km | €3,789.98 | €0.26 |
| Synapse (road, most-ridden) | 22,520 km | €5,621.40 | €0.25 |
| Six (road, retired, no parts tracked) | 9,981 km | €1,399.00 | €0.14 |
| All four | 50,442 km | €15,421.95 | €0.31 |
A 9.5x spread across bikes I own simultaneously. None of them is a bad purchase and none is unusually expensive. The spread is almost entirely distance and upgrade level: the Scalpel has had the most money spent on it and covered the least ground, the Synapse the reverse.
This is the strongest version of the argument in this post. If you want a bike with a good cost per kilometre, the lever is not the shopping list. It is which bike you actually reach for.
Even the fleet number has a denominator problem
My profile shows the garage at €15,421.95 across 52,519 km. Divide one by the other and you get €0.29 per km. The table above says €0.31. The difference is 2,077 km ridden on two bikes I have not recorded costs for — real kilometres with no spend attached to them, quietly flattering the average.
It is a small error here. It would not be small if half your fleet were untracked, and it is worth knowing before you quote a fleet figure at anyone: a bike with no recorded cost makes your whole garage look cheaper.
What counts as normal
Here is the honest state of the evidence: there is no published benchmark for what a bike costs its owner per kilometre. I looked. What exists measures adjacent things, and conflating them is the most common error in this topic.
The number you will find quoted most is €0.08 per kilometre for a bicycle against €0.50 for a car, from a Copenhagen cost-benefit study by Stefan Gössling and Andy Choi, published in Ecological Economics in 2015 and summarised by Lund University. It is a real and rigorous figure, and it is not your running cost. It combines private and societal costs — health outcomes, congestion, air quality, road wear, infrastructure. It answers "what does a kilometre of cycling cost society", not "what does my bike cost me".
For the private side, the closest usable anchor is servicing. UK data compiled by NimbleFins and reported by Coach puts a bike service around £35 a time, with a recommended cadence somewhere between three and eighteen months depending on use.
Which leaves you computing your own. That is the actual answer, and it is why this number is worth tracking rather than looking up.
What actually moves the number
Most riders trying to lower their cost per kilometre go shopping. That is the wrong half of the fraction.
The upgrade paradox: the denominator is where the gains are. Riding 4,000 km instead of 2,000 halves your cost per km without you spending a cent differently. Meanwhile a €60 chain replaced on time lowers your cost per km more than a €30 chain replaced late, because the late one takes the cassette with it. Cheap-per-item is not cheap-per-kilometre, and the fastest route to a good number is a bike that gets ridden.
Three things that move it, in order of size:
- Kilometres ridden. The dominant term, and the only one that improves the figure while also being the point of owning a bike.
- Chain timing. Replacing the chain before it damages the cassette and chainrings is the highest-return maintenance habit there is. The arithmetic of getting it wrong is in how a €40 repair becomes a €400 one, and the measurement side is in chain maintenance 101.
- Keeping the bike. Depreciation is steepest early. A bike held and ridden for six years has a far better all-in figure than the same bike sold after two, which is also why a documented service history is worth money at resale.
What barely moves it: the price of individual consumables. The spread between a budget chain and a good one is a few euro across thousands of kilometres. If you want the lifespan figures that feed the arithmetic, they are in how long do bike parts last; the habit side is in how cleaning and tracking pay for themselves.
How WatchMy.bike calculates it
Cost per kilometre only works if each component knows its own distance, which is the part that is tedious by hand and the reason most riders never compute it.
Every bike and component takes a purchase price. Enter what you paid, when you bought it.
Distance comes from your rides. Connect Strava and each component accumulates its own kilometres, separate from the bike it is fitted to. That distance is what turns a price into a rate. Strava is the only sync source today — Garmin and Wahoo are on the roadmap, not shipped — so other bikes are tracked by entering distance yourself.
Build cost and cost per kilometre are calculated for you. Build cost is the bike's purchase price plus the price of every component currently fitted. Cost per kilometre is the burn-rate figure from the worked example: the bike's price divided by the bike's distance, plus each fitted component's price divided by that component's own distance. Both sit on the bike's page, and on its public page if you choose to show costs. Uninstalled parts drop out of both the moment you remove them.
Cost per km is an Alloy feature, at €39 a year; entering purchase prices and seeing the build total is free on every plan. The lifetime average — total spend divided by total distance — is the one division the app leaves to you, on purpose: it needs the kilometres a part did before you owned it, and the app only counts the ones it can see.
One honest limit: WatchMy.bike does not model depreciation or resale value. It gives you the running-cost side accurately and the purchase side as what you paid. The depreciated figure in the all-in formula above is something you work out yourself.
Set up these three and the cost side stays current:
- "Chain wear" — distance interval, every ~3,000 km, so the cheap part gets replaced before the expensive ones
- "Drivetrain audit" — time interval, every 6 months, to record what you have actually spent
- "Annual service" — time interval, every 12 months, with the invoice attached as a document
FAQ
How do I calculate cycling cost per kilometre?
Divide spend by distance, and be explicit about which denominator you used. A lifetime average is total spend divided by the bike's distance: my own mountain bike is €4,611.57 over 3,470 km, so €1.33 per km. A current rate divides each component by its own distance and sums them, which for the same bike gives €2.27 per km because recently fitted parts have few kilometres on them. Neither is wrong; quoting one without saying which is why published figures for this vary by a factor of ten.
What is a normal cost per kilometre for a road bike?
There is no published benchmark for personal cycling cost per kilometre, which is worth knowing before you trust a figure you find quoted. The academic number in circulation, €0.08 per km, comes from a Copenhagen study measuring combined private and societal cost including health and congestion — not what a rider spends. Your own running cost is the only figure that means anything, and it is arithmetic you can do in ten minutes once component distances are tracked.
Does cost per kilometre include the price of the bike?
In the all-in figure, yes, but as depreciation rather than purchase price. A €4,000 bike now worth €2,500 has cost you €1,500 so far. Using the full €4,000 while you still own the bike overstates the cost, because you have not spent that value yet.
Is there an app that calculates cycling cost per kilometer?
Yes. WatchMy.bike tracks a purchase price per bike and per component, accumulates distance per component from your Strava rides, and reports cost per kilometre on the Alloy plan at €39 a year. ProBikeGarage also offers cost tracking. What no app currently does is model depreciation, so the all-in figure remains a manual calculation.
How do I lower my cost per kilometre?
Ride more. Distance is the dominant term and doubling it halves the figure at unchanged spend. After that, replace the chain on time so it does not destroy the cassette behind it, and keep the bike longer, because depreciation is steepest in the first two years. Buying cheaper consumables barely registers.
Does riding more actually make cycling cheaper per kilometre?
Per kilometre, yes, and substantially. Fixed costs — the bike, the annual service, the calendar-based items like brake fluid and sealant — are spread over more kilometres. Consumable costs rise roughly with distance, so they stay flat per km. The result is that the rider doing 8,000 km a year has a much better rate than the one doing 2,000, on the same bike.
Should I count my own labour as a cost?
Whichever you choose, be consistent. Most riders doing their own work count only parts, which makes their running cost look lower than a shop-serviced rider's for identical maintenance. If you want the two comparable, add a notional labour rate — or just note which convention your number uses.
Questions about tracking what your bikes cost? Reach out at marien@WatchMy.bike.